MEEG single trial metrics
Measuring the quality of MEEG single trials
What's the goal?
In a typical MEEG data acquisition session, many trials for a given experimental condition are collected. We know there are variations from trial to trial and some of those variations are measurement errors, others are physiological by nature, and can sometimes actually be relevant and underlie behavioural variability. There is, therefore, some interest in being able to come up with some metrics for each trial.
Time-series metrics
What metrics can be of interest for time-series? or spectra for that matter. Importantly I want those metrics to be independent of specific features in the data. That is we can compute various ratios and variations around/between/among features (e.g. peaks) but this requires to define features. So what's left:
- temporal SNR is a classic, that's the standard deviation over time, telling us how much variation we have over time
- total power gives another picture with how much energy a given trial generated and is related to tSNR
- autocorrelation indicates the smoothness of the data
There is one more, that does depend on a reference. Sometimes, we want to know how much a trial differ from 'others' ; but this other cannot be the mean because the mean is computed using the trial of interest - of one provide a reference mean then we can compute the amplitude deviation
- amplitude variation, that's the standards deviation from a reference trial
What's does that look like?
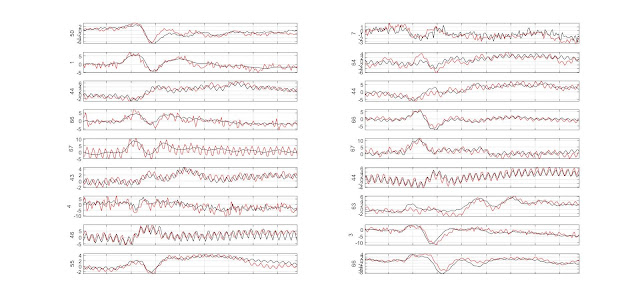
Here is an example from 18 subjects and I want to compare the trials underlying those black and red mean ERPs (from Wakeman and Henson, 2015). FYI those were defined as being different in multivariate space, but I want here to know what this means back into the standard time domain.
Temporal SNR
Comparing the red and black trials subject-wise (bootstrapped 20% trimmed mean differences) show that 12/18 subjects plotted above (subjects 2, 3, 4, 5, 6, 7, 8, 11, 13, 14, 16 and 17) have more variable red trials.
Taking the mean values across all black vs. red trials, the group comparison for figure 1 above, show a significant difference. If the mean is taken not just across all trials but also all channels, the effect is smaller and not significant.
Total Power
Comparing the red and black trials subject-wise (bootstrapped 20% trimmed mean differences) show those same 12/18 subjects have an effect, i.e. since red trials are more variable they are more powerful.
Taking again the mean values across all black vs. red trials, the group comparison for figure 1 above, show a significant difference. If the mean is taken not just across all trials but also all channels, the effect is smaller and not significant.
Autocorrelation
Comparing the red and black trials subject-wise (bootstrapped 20% trimmed mean differences) show that 12/18 subjects have an effect, i.e. red trials are more repeating themselves and thus less smooth - 9 subjects are the same as before (3, 4, 5, 7, 8, 11, 13, 16 and 17) and 3 uniquely show this effect (9,12,18).
As before, the group comparison of mean values across all black vs. red trials in figure 1 above, shows a significant difference. If the mean is taken not just across all trials but also all channels, the effect is smaller and not significant.
Amplitude variations
Since those red and black averages/trials comes from a channel-wise multivariate 'distance', maybe unsurprisingly the mean amplitude variations of red trials compared to the mean of black trials are significant for every subject, at the group level, both for the max channels and averaged across all channels. This last result is interesting to me, because the channel-wise distance seem to capture trials with different dynamics (tSNR/smoothness) leading to full scalp differences in amplitudes, and apparently, it's ok to use averages for ERP .. maybe not, but that's another story.
Conclusion
tSNR and Power capture the same information albeit different interpretation, and autocorrelation gives us an idea of smoothness which is somehow inverse of tSNR but goes beyond it - maybe the best metric to capture how noisy data are. Finally, amplitude variations confirm differences of any trial to a reference but I'm not sure it's that useful - I'd happily take comments on all that.


Comments
Post a Comment