On confidence vs capture percentage intervals
How often Confidence Intervals of the mean
captures the next sample mean?
The Confidence Interval of the sample mean
A typical interpretation error for confidence intervals (CI) is to think that they provide coverage for the statistic of interest. The 95% CI of the sample mean is thus often interpreted either as the interval for which there is 95% chance to include the true mean (Morey, Hoekstra, Rouder, Lee, & Wagenmakers, 2015). The correct interpretation is an interval for which the true mean will fall 95% of the time, on repeated measurements. This is an important distinction, as the correct interpretation does not say anything about the probability of the interval. Remember that the CI is computed using a cumulative (normal for the mean) distribution and thus it refers to the long run probability. This means that, by repeating the same experiment on subjects from the same population and using the same sample size, the 95% CI will include the population mean 95% of the time on average. This also implies that the CI does not say anything about the actual sample mean. This is easy to demonstrate using a simulation: first generate a reference population, then take a sample and compute the 95% CI of the sample mean and check the population mean is in this interval. [Matlab code]
Define a population of 1 million individuals mean 5
True_mean = 5;
Pop = randn(1,1000000)+True_mean;
rst_density_hist(Pop)
Pop = randn(1,1000000)+True_mean;
rst_density_hist(Pop)
SS = [10:10:100 200 300 400 500 600 700 800 900 1000];
N = length(SS);
N = length(SS);
Simulate 10000 repeated experiments
alphav = 5/100; % this is the a priori level of acceptance (Newman-Pearson)
NbMC = 10000; % simulate 10000 repeated experiments
Errrors = NaN(N,NbMC); % Errors is the matrix of CI that does not include the true mean
f = waitbar(0,'Number of simulations','name','MC');
parfor MC = 1:NbMC % for each simulation
waitbar(MC/NbMC);
X = randi(1000000,1,SS(end)); % draw 1000 subjects from Pop
CI_ttest = NaN(2,N);
for s=1:N % and compute the 95% CI of the mean for multiple sample size
tmp = Pop(X(1:SS(s)));
Deviation = icdf('T', 1-alphav/2,SS(s)-1)*(std(tmp)./sqrt(SS(s)));
CI_ttest(1,s)= mean(tmp) - Deviation;
CI_ttest(2,s)= mean(tmp) + Deviation;
end
Errrors(:,MC) = ((True_mean <= CI_ttest(2,:)) + (True_mean >= CI_ttest(1,:))) ~= 2;
end
close(f)
figure;
subplot(3,3,[1 2 4 5]); imagesc(NbMC,SS,Errrors); colormap('gray')
xlabel('experiment #','FontSize',14); ylabel('Sample Size','FontSize',14);
title(['Errors: mean=' num2str(mean(mean(Errrors,2)))],'FontSize',16);
fprintf('The average error across all sample size is %g\n', mean(mean(Errrors,2)))
subplot(3,3,[7 8]); plot((sum(Errrors,1))); ylabel('# of errors','FontSize',14); grid on; box on;
subplot(3,3,[3 6]); plot(SS,mean(Errrors,2),'ro'); hold on
plot(SS,mean(Errrors,2),'LineWidth',3); title('type 1 error rate','FontSize',14);
axis([0 1000 .04 .06]); set(gca,'xdir','reverse'); camroll(90); grid on; box on;
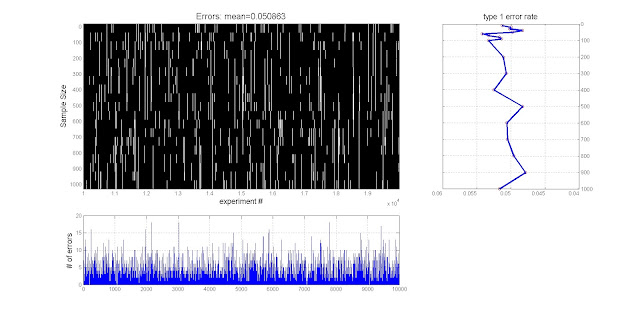
The simulation results are spot on, 5% of the time the CI did not include the true population mean.
The capture percentage of the sample mean
What about replications? If the 95% CI of the sample mean, include the true population mean 95% of the time, surely it will also include the mean of a replication study. From theoretical analysis, (Cumming & Maillardet, 2006) showed that, on average, a new study with the same sample size has 83% chance to have the sample mean in the 95% CI of the 1st study. The capture percentage can easily be obtained by finding the alpha level which gives a CI with the expected coverage - in Matlab:
CP = 95; % we want 95% coverage of the mean
value = icdf('T',1-CP/100,SS-1)*sqrt(2); % get the critical T values for sample size SS
alphav = tcdf(value,SS-1); % get adjusted alpha values
value = icdf('T',1-CP/100,SS-1)*sqrt(2); % get the critical T values for sample size SS
alphav = tcdf(value,SS-1); % get adjusted alpha values
The problem is that most of the time, the sample size will differ. A power analysis for instance will indicate to recruit more or less subjects – what are the chances to be in the 95% CI then? Again, we can run a little simulation: take a sample and compute the 95% CI of the sample mean, take a new sample a check if the new sample mean is within the 95% CI. Do that for multiple combinations of sample sizes.
replicate = NaN(N,N,NMC); % binary indicating if study to sample mean is within study 1 CI
f = waitbar(0,'Number of simulations','name','MC');
parfor MC = 1:NbMC
waitbar(MC/NMC);
% 1st study
X = randi(1000000,1,SS(end)); % draw subjects from Pop
Data = NaN(SS(end),N); index = 1; % the data are from 10, 20, 30, 40 .. to 1000 subjects
for s=1:N
Data(1:SS(s),index) = Pop(X(1:SS(s)))';
index = index+1;
end
[~,~,CI1] = ttest(Data); % compute the 95% CI
% 2st study
X = randi(1000000,1,SS(end)); % draw subjects from Pop
Data = NaN(SS(end),N); index = 1; % the data are from 10, 20, 30, 40 .. to 1000 subjects
for s=1:N
Data(1:SS(s),index) = Pop(X(1:SS(s)))';
index = index+1;
end
mean_values = repmat(nanmean(Data,1)',1,N);
% test if the mean values are within the 95% CI of the 1st study
replicate(:,:,MC) = ((mean_values >= repmat(CI1(1,:),N,1))+(mean_values <= repmat(CI1(2,:),N,1)))==2;
end
close (f)
% replicate dimensions are
% dim1 (rows) the mean values of study 2 for N=10:10:100
% dim 2 (columns) the replications of these values to match CI of study 1 for N=10:10:100
% dim 3 are the 10000 random draw
percentage_correct = mean(replicate,3).*100;
% for equal sample sizes we have the expected 83%
EqualSS = diag(percentage_correct);
figure; colors = jet; colors = colors(1:floor(64/N):64,:); set(gcf,'Color','w');
subplot(2,2,1);imagesc(SS,SS,percentage_correct);
title(['Percentage correct - mean(diag)=' num2str(mean(EqualSS))],'Fontsize',16);
xlabel('study 1 sample size','Fontsize',12);
ylabel('study 2 sample size','Fontsize',12);
subplot(2,2,2);
for s=1:N
plot(SS,percentage_correct(s,:),'LineWidth',3,'Color',colors(s,:)); hold on;
end
axis([0 SS(end) 1 100]); plot(SS,repmat(83,1,N),'k--')
grid on; box on; title('Percentage correct','Fontsize',16);
xlabel('study 1 sample size','Fontsize',12);
ylabel('percentage correct','Fontsize',12);
legend('10','20','30','40','50','60','70','80','90','100','200','300','400','500','600','700','800','900','1000','Location','BestOutside')
%fig2plotly(gcf,'strip',false,'offline', true);
The results show that as little as ~15% of replications will provide a sample mean that falls within the 95% CI of the original sample, and if many more subjects are collected, it will be 100% correct. In short, we cannot predict what value the sample mean is going to be based on CI. What I take from that is CI are useful to show multiple conditions / differences, because this reflect a statistical test, but that's about it.
References
Morey, Hoekstra, Rouder, Lee, & Wagenmakers (2015). The fallacy of placing confidence in confidence intervals. Psy Bulletin and Review, 1-21Cumming & Maillardet (2006). Confidence intervals and replication: Where will the next mean fall? Psy Method 11, 217-227
see also http://daniellakens.blogspot.co.uk/2014/12/98-capture-percentages-and-999.html


Comments
Post a Comment